 |
||||||||
The Three Color Composite Process
for STM Images
|
||||||||
| The fact that some sample surfaces exhibit a very strong bias dependent apparent topography led me to the idea to use this fact to obtain STM images in color by a three-color composite process. Although the color variations in the STM images have physical reasons and include physical informations about the sample surface neglected in the classical single bias STM topograph, I mainly see this technique in an artistical context, as a way to increase the aesthetics of the STM images. | ||||||||
|
||||||||
| The basic principle
of the scanning tunneling microscope
is a tip that scans the surface of the sample. A bias is set to the
sample
and the resulting tunneling current is used to keep the distance
between
tip and sample surface constant. Consequently, the tip of the scanning
tunneling
microscope follows the surface topography of the sample. So how is it possible to obtain any additional information that can be converted into a color information? The previous assumption is only a good approach to the truth. Actually, the tip of the STM follows the density of states at the surface; this density of states is closely related to the sample topography, but it is not identical to it, variations in chemical composition or geometrical structure may lead to strong variations in the density of states of the surface. The density of states the STM sees depends on the energy of the tunneling electrons, and this energy can be chosen by the tunneling bias. |
||||||||
 |
||||||||
| Figure
1: Bias dependent apparent STM-topography |
||||||||
| The
sketch in Fig.1
shows what the STM sees of the sample at different tunneling bias. It
shows a cross section of a
sample surface with two surface atoms being replaced by foreign atoms,
for instance adsorbates (black). While at low bias (red) the tip may
follow the "actual"
topography, there may also be a bias where no contrast is obtained
(green)
or a bump is seen above the adsorbates (blue). Exactly this bias dependent imaging is used to create the color images: three individual STM images of the same sample area are obtained at different tunneling bias. The three images are combined in RGB mode, with the lowest bias image as red, the highest bias image as blue. In Fig.2 I will demonstrate this in an example. |
||||||||
|
||||||||
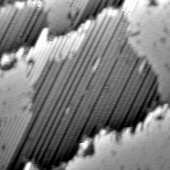
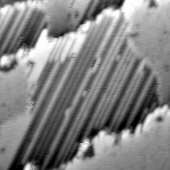
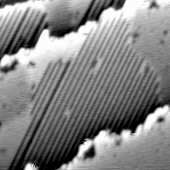
| Figure
2: three STM topographs at different bias for an STM color image |
||||||||
| The three STM topographs shown in Fig.2 are obtained at the same sample area but with different tunneling bias. One can clearly see, that the apparent topography, especially of the striped areas, changes with the applied bias. | ||||||||
|
||||||||
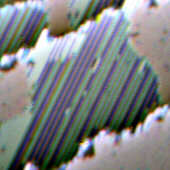
| Figure
3:
combination of the three STM topographs in RGB mode |
||||||||
| Figure
3 shows the
three STM images after beeing combined in RGB mode (left) and after a
contrast enhancement (right). The combination of three grayscale images
to a color image is a standard feature in most image processing
software, for instace Corel Photo-Paint or Adobe Photoshop. In most
cases, the color saturation is enhanced by a factor of two or three.
Besides this procedure, no additional colorization of the images or any
change in the color balance is carried
out. The "convention" of setting the lowest bias image as red, the highest bias image as the blue channel was choosen by me in analogy to the photon energy of light being lower for the longer wavelength (red). Two different STM three-color composite images that show the same material may show it with different color - this is because the absolute or zero level is not the same for all images, since it is set to give a good contast for all parts of the image. Consequently, one can not identify a surface from its absolute color in the images, only the color variations within one and the same image have a physical meaning. |
||||||||
| Other
tips and techniques Tunneling spectroscopy: An other technique to colorize an STM image is via its current imaging tunneling spectroscopical measurement. Three spectroscopical images at different bias are combined the same way as shown above, and an STM topograph (in most cases with higher resolution than the spectroscopical image) that was made before or after the tunneling spectroscopy is colorized with this information. Distorted images: The case I described above was an ideal case, where all images fit. Normally the images are individually distorted. This is due to the fact that we portray the sample down to a very small scale. Any variation in temperature results in a temperature expansion of the sample or the components of the STM. The resulting distortion of the images is called "drift", it is a well known problem in scanning tunneling microscopy. Most of the images presented here were made after spectroscopical measurements which require about ten hours. After such a long time, the STM is in thermal equilibrium. So these images in many cases are "waste-products" of other time-intensive measurements. Nevertheless, most of the images had to be corrected for distortion, but it is very helpfull if the distortion is only linear and not of higher order. Large topographical differences: If the image contains features with a topography much larger than the small bias dependent differences, for instance islands, the color information will get lost in the large topographical contrast. In these cases partially differentiated images are used. Normal STM images with large topographical differences are very often presented as differentiated images, the sample topography looks as if the surface is illuminated in grazing incidence. In images presented this way large as well as small topographical features are clarly visible at the same time. |
||||||||